-
Introduction
-
Database Application
-
Overview of Commands
-
Layout
-
Electric
-
Evaluation
-
Data Export
-
Presentation
-
Analysis
-
===============
-
FAQ – Frequently Asked Questions
- How is the calculation of the row distance / shadow cast?
- How can I add a prototype-drawing to Helios 3D?
- What does the message “This drawing was last saved by an earlier version of one of the following products:” mean?
- How can I improve the performance of huge projects?
- Why does the Selection Dialog for Prototype Drawings not appear?
- Why are Project Numbers not Managed automatically?
-
Step-by-step Tutorials
-
Useful Hints and Tips
-
Releases
- Helios 3D Update 2026.0.1.5
- Helios 3D Update 2026.0.1.4
- Helios 3D Update 2026.0.1.3
- Helios 3D Update 2026.0.1.2
- Helios 3D Update 2026.0.1.1
- Helios 3D Update 2026.0.1.0
- Helios 3D Update 2025.0.1.4
- Helios 3D Update 2025.0.1.3
- Helios 3D Update 2025.0.1.2
- Helios 3D Update 2025.0.1.1
- Helios 3D Update 2025.0.1.0
- Helios 3D Update 2024.0.1.7
- Helios 3D Update 2024.0.1.6
- Helios 3D Update 2024.0.1.5
- Helios 3D Update 2024.0.1.4
- Helios 3D Update 2024.0.1.3
- Helios 3D Update 2024.0.1.1
- Helios 3D Update 2024.0.1.0
- View all articles ( 3 ) Collapse articles
Slope Analysis
0 out of 5 stars
| 5 Stars | 0% | |
| 4 Stars | 0% | |
| 3 Stars | 0% | |
| 2 Stars | 0% | |
| 1 Stars | 0% |

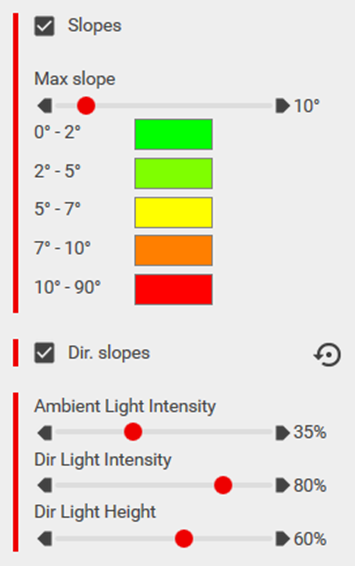
In the first submenu, you can analyze slopes. The „Slopes“ checkbox enables the display of areas with the set maximum slope (limit for the rack structure or ramming machine). For example, if you set a maximum slope of 15°, areas with slopes greater than this will be displayed in red.
The following figure shows an example illustrating this scenario.
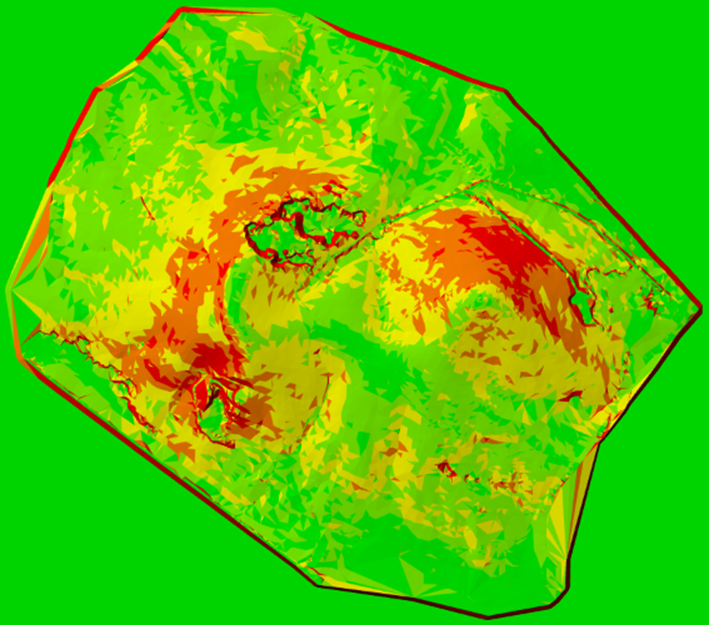
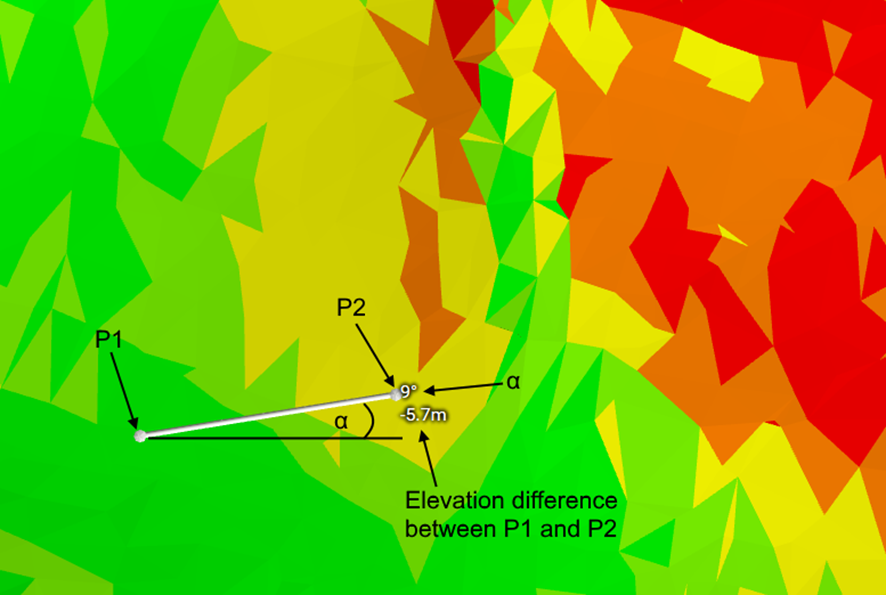
The additional option „Directional slopes“ adjusts the displayed slope to reflect the slope in a specific direction, such as aligning with the direction of the array rows.
For example, if a maximum slope of 10° is set in the array definition, the configuration will display the slope values in the direction of the array rows, helping you visualize the terrain in relation to the orientation of the racks.
After selecting the „Directional slopes“ option, you can draw a line with your mouse to define the direction of the slope. This line will determine the orientation for the displayed slope analysis, such as aligning with the array rows or another desired direction.
With the reset button, you can reset the line you’ve drawn to redefine the slope direction.

You can also adjust the display colors using sliders for ambient light intensity, direct light intensity, and direct light height to fine-tune the visual representation of the terrain and slopes.
0 out of 5 stars
| 5 Stars | 0% | |
| 4 Stars | 0% | |
| 3 Stars | 0% | |
| 2 Stars | 0% | |
| 1 Stars | 0% |