Performance analysis

The performance analysis functions require the Electric module (for cable losses) and the Yield Assessment module (for system performance, peak performance, and high/low markers) to be enabled. The results of these calculations are then transferred to the WebGL scene.
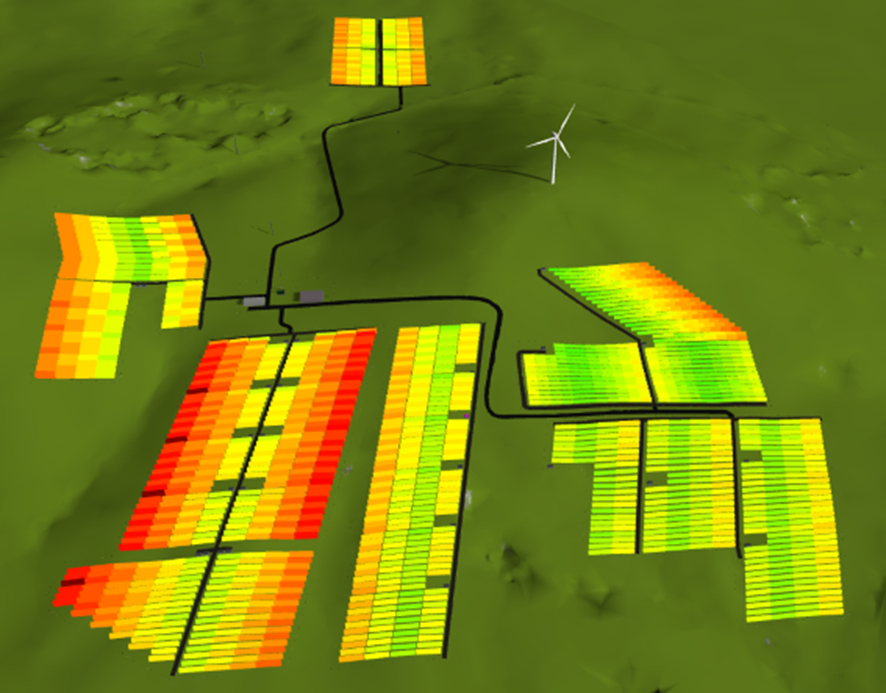
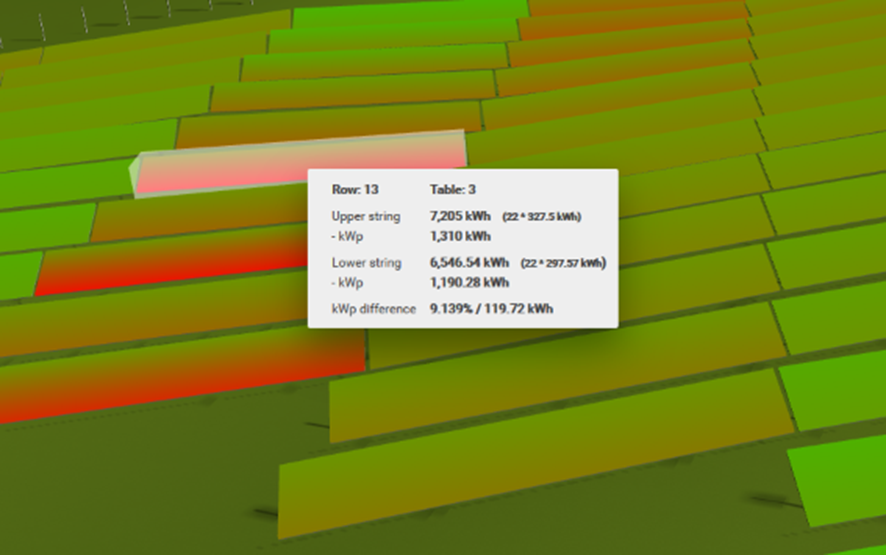
Show System Performance
This feature displays the performance efficiency of the system layout. For each array, it highlights the performance variation between the first and last module strings. The tooltip provides detailed insights, as demonstrated in the following figure, which illustrates a rack with significant performance variation (9.139%).
This function highlights performance differences (kWp) within an array. However, these differences do not necessarily indicate poor overall performance of the array.
Peak Performance
The kWp yield represents the power output per 1,000 W of installed capacity.
Show High/Low Markers
This feature highlights the best- and worst-performing arrays with specific markers, making it easy to identify performance variations within the system.
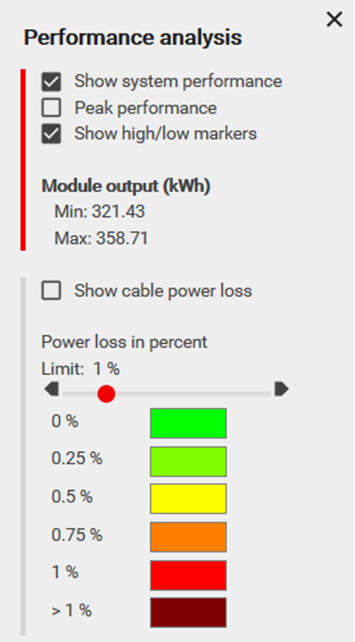
Show Cable Power Loss
This function visualizes cable power losses using a predefined color scheme. You can set a threshold for acceptable losses, with any losses exceeding this limit displayed in a signal color for better visibility.
The colors in the scheme can be customized by clicking on them. The next figure illustrates an example using the default color scheme.