Fields
It consists of a closed „Polyline“ or „3D Polyline“ that must be entirely located within an area. Helios 3D automatically establishes a connection between the field and the area in which it is situated.
The following subsections describe the properties of a selected field.
Placement (Field Tab)
In the “Field” tab, you can configure the placement options for a field. The following figure shows all the options available for placing arrays.
Buttons of the Field Tab
The description of the commands for placement can be found in Section „Command Group Placement„.
(Note: The commands within the Field tab may be removed in a future version.)
Sun / Irradiation angle
You can override the sun position data from the project page for each field to adjust the shadow casting direction for all placements.
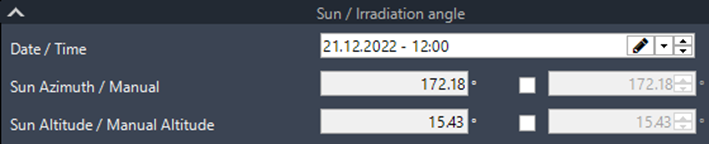
Date / Time
Enter the date and time for the specific placement. This value will override the project settings for the selected field.
Sun Angle / Manual Sun Angle
The sun angle is calculated based on the geographic location of the project and the date-time setting for the selected field. You can manually override the angle if needed.
Sun Angle / Manual Sun Angle
The sun angle is calculated based on the geographic location of the project and the date-time setting for the selected field. You can manually override this angle if necessary.
Common
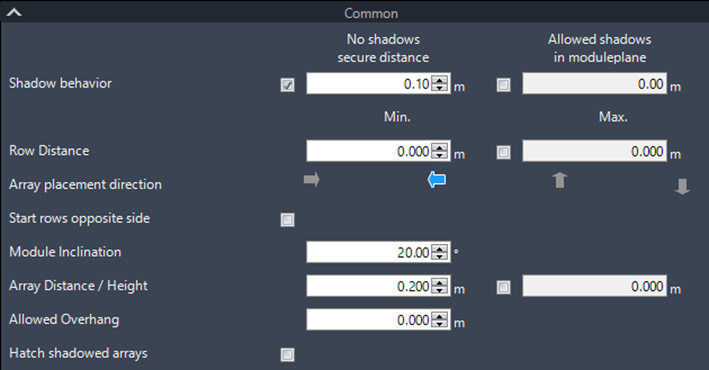
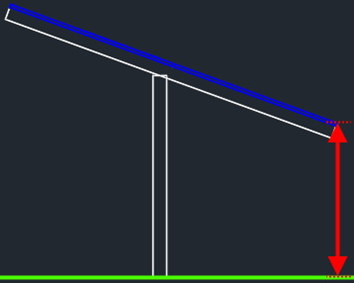
Shadow behavior – No shadows with secure distance
Allows you to adjust the safety margin for the distance between the shadow and the array’s bottom edge, ensuring that shadow-free conditions are maintained for all modules.
Shadow behavior – Allowed shadows in module plane
The row distances are generated in such a way that the longest shadow from the previous row perfectly aligns with the set shadow depth on the modules of the next array row.
Row Distance Min. / Max.
Sets the minimum and maximum distance between a row and the subsequent row.
Array placement direction

Sets the direction for the array rows based on the arrow direction.
Start rows opposite side
This option can be used when a minimum row distance is set. It utilizes the arrow and sun settings to switch the first row to the opposite side of the field. As a result, the array blocks are also rotated.
The shadows will still follow the set sun settings, so if shadow positioning remains important, you will need to continue using the sun azimuth moving forward.
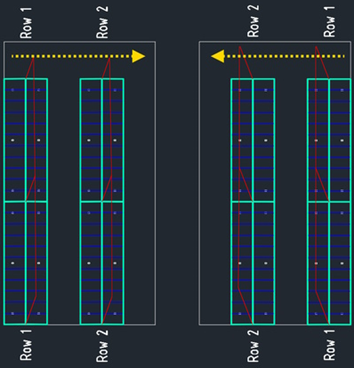
As the array azimuth is rotated, the modules of fixed-tilt arrays will point in the opposite direction. For example, a previous placement with an array azimuth of 0° will now have an azimuth of 180°.
Module Inclination
Here, you can set the module inclination for each array within the selected field.
Array Distance
Sets the distance between neighboring arrays, taking their rotation within a row into account.
Array Height
Overrides the insertion height of a PV table above the surface, which was originally set in the array generator.
Allowed Overhang
Sets the allowed overhang for arrays at the end of the field. This setting is useful when there are many rows with gaps at the end of the field, and the gaps are just slightly smaller than the size of an array.
Hatch shadowed arrays
Creates a hatch over the arrays that are affected by the shadow of any array from the previous row. This function is useful when a shadow-free placement criterion needs to be disregarded during placement.
Limits / Conflicts
Max. Slope – North/East – South/West
Enable an input field to override the general slope limit specified in the array definition within the array generator. If disabled, the slope limit from the array definition will be applied.
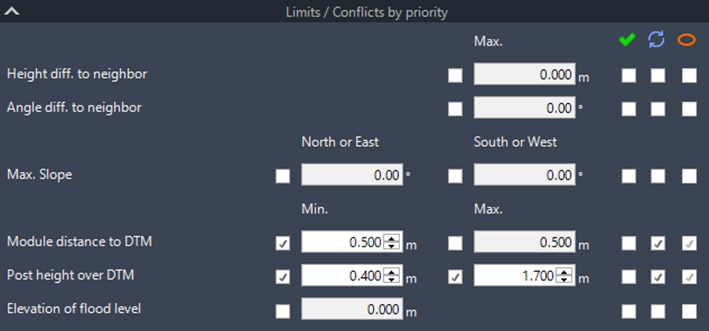
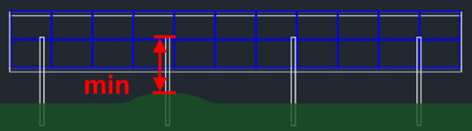
Module distance to DTM – Min. / Max.
Defines the minimum and maximum allowable distances between the modules and the surface. These limits are evaluated at both the front and back edges of the modules, as well as between adjacent rows of modules. This ensures that any variations in elevation beneath the array are accurately detected.
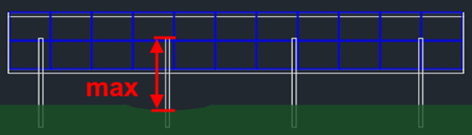
Post height over DTM – Min. / Max.
Defines the minimum and maximum height of the post head relative to the ground.
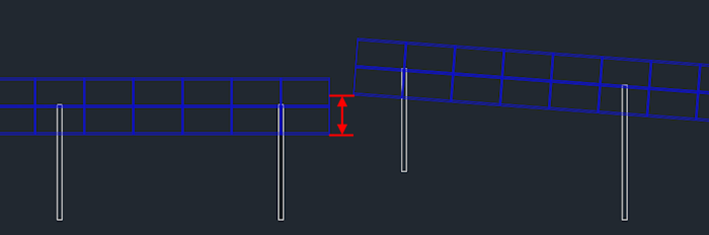
Height difference to neighbor array
Evaluates the height difference relative to the previously installed PV table to prevent shading within the table row.
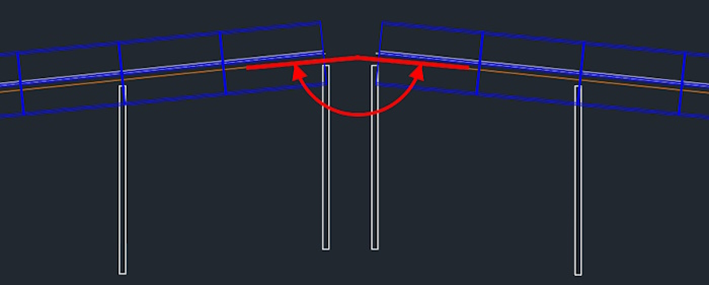
Angle difference to neighbor array
For trackers, it may be necessary to impose limitations on the angle between neighboring modules.
Elevation of flood level
Treats all surface points below the specified height as flooded, excluding them from placement.
The placement statistics display all detected conflicts, along with their corresponding colors.
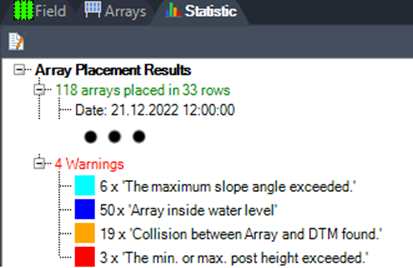
Each conflict can be addressed using the following options:

Ignores the conflict and places the PV table, marking it with an „X“ on a conflict-specific layer and color. The placement statistics display a warning, highlighting the conflict color and indicating the number of affected arrays.

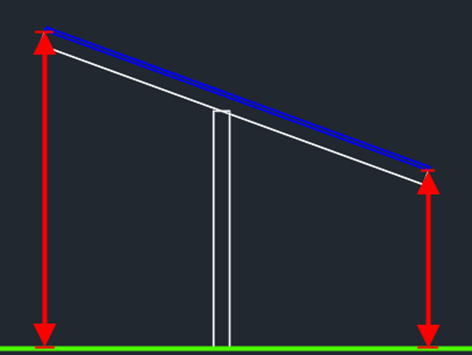
Depending on the conflict type, either the lower end of the array or the entire array is raised to meet the corresponding limit value.

Creates an ellipse marker for adjusted arrays, placing them on a layer labeled with the conflict name and the suffix „_Aligned“. For example: H3D_Table_MaxSidePitch_Aligned.
The color for each conflict is assigned to the corresponding layer.
- Side slope: Layer H3D_Table_MaxSidePitch, default color cyan
- Module distance to DTM: Layer H3D_Table_InvalidTableHeightMarker, default color orange
- Post height over DTM: Layer H3D_Table_InvalidPostHeightMarker, default color red
- Height difference to neighbor: H3D_Table_InvalidNBHeightDiffMarker
- Angle difference to neighbor: H3D_Table_InvalidNBAngleDiffMarker
- Module distance to flood level: Layer H3D_Table_WaterLevel, default color blue
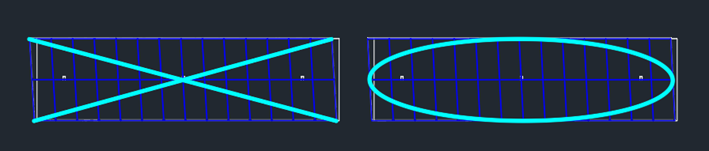
The following figure illustrates a table that disregards the slope conflict on the left side, and an aligned table with the resolved conflict on the right side.
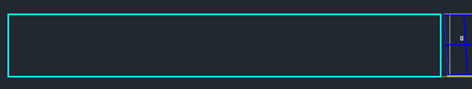
When a conflict is not addressed, a temporary rectangle is inserted in place of the array. You can either hide it manually or wait for the next update of internal objects to automatically remove the temporary markers.
Unresolved Conflicts
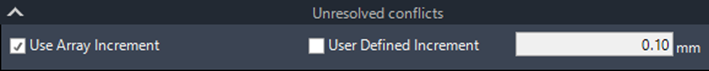
Use Array Increment
This option skips the affected arrays during placement, creating a gap in the row where the full array length would have been. The advantage is that arrays from the rows above can remain aligned in a straight line.
User Defined Increment
This option moves the affected arrays further along the direction of the row until a valid location is found. The set value represents the step width for each move.
Power and Array Limits
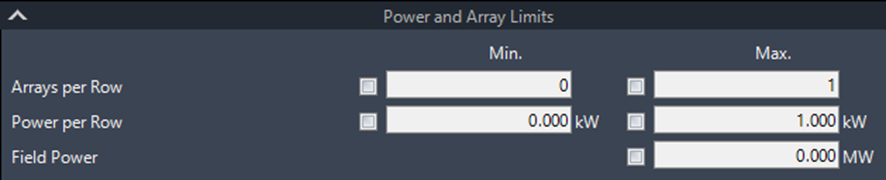
Arrays per Row – Min. / Max.
Sets the minimum and maximum number of arrays per row. A row will not be inserted if the minimum number of arrays is not met. For the maximum, the row will be stopped once the limit is reached, and placement will continue with the next row.
Power per Row – Min. / Max.
Sets the minimum and maximum number of arrays per row based on the total power of the row in kWp. A row will not be inserted if the minimum power threshold is not met. Once the maximum power is reached, the row will be stopped, and placement will continue with the next row.
Field Power – Max.
Sets the maximum number of arrays for the field based on the total power of the entire field in kWp.
Array Groups and Row Groups
This option enables placing groups of arrays within a row and defining the distance between these groups.
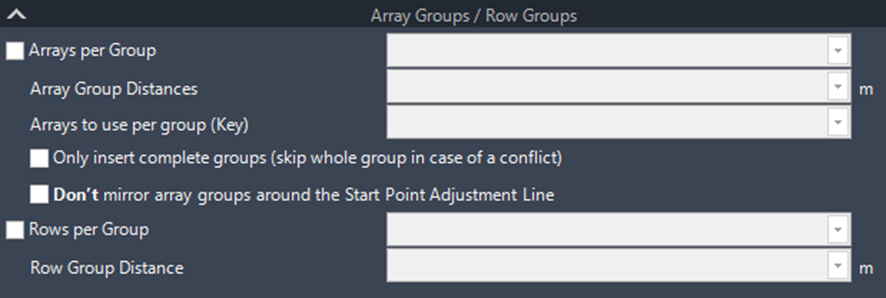
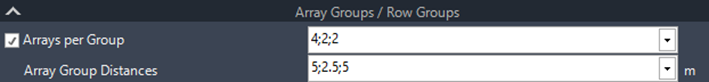
When enabled, you can specify the number of arrays per group and the distance between these groups. Within each group, the standard array distance is applied. Additionally, you can assign a specific array definition to a group using a key.
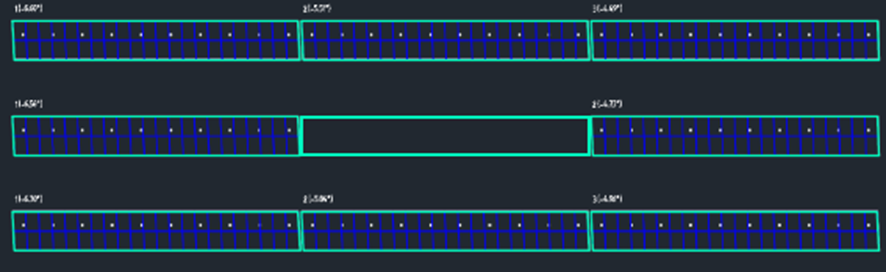
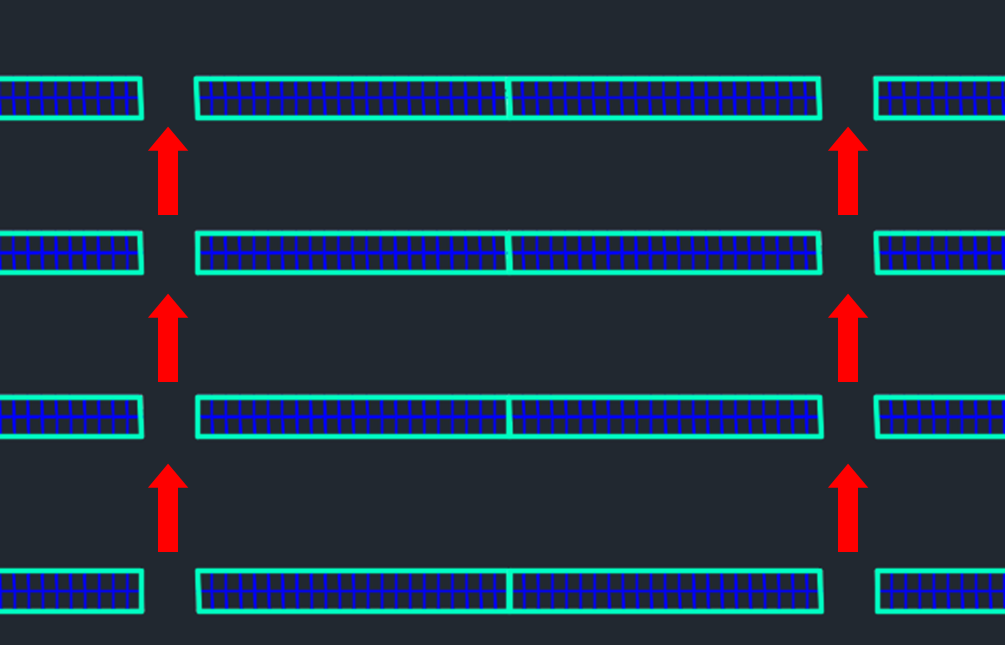
If you intend to use this feature to create access paths or service roads through the field, it is essential that the starting points of all rows are aligned. This ensures that the arrays in subsequent rows, as well as the gaps between groups, remain in alignment (see the next figure).
Additionally, you can add a list of groups if varying distances between the groups are needed. The distances for each group can be specified as non-decimal values, separated by semicolons.
The „Distance“ field sets the gap before the next group, where decimal values are also allowed. The dot is used as the decimal separator, and the semicolon separates the different distance values.
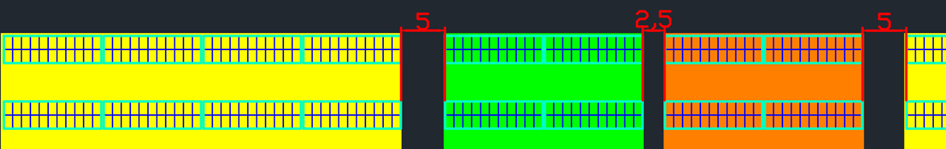
For example, a configuration might include a group of 4 arrays followed by a 5-meter gap (yellow). Next, a group of 2 arrays is placed, followed by a 2.5-meter gap (green). After another group of 2 arrays, a 5-meter gap (orange) is inserted before the pattern repeats.
The result of the configuration looks like this:
- A group of 4 arrays is placed, followed by a 5-meter gap (yellow).
- Next, a group of 2 arrays is placed, followed by a 2.5-meter gap (green).
- Another group of 2 arrays is placed, followed by a 5-meter gap (orange).
- The pattern then repeats, starting again with the first group and gap configuration.
This pattern ensures the arrays and gaps follow the specified distances and groupings.
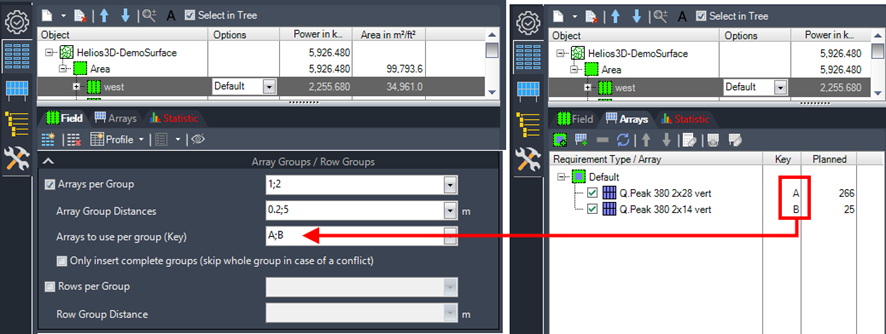
For array groups, you can now specify which table of the requirement type should be used in each specific group.
For example, if you want to place a “YL 2×22” table followed by two “YL 2×11” tables repeatedly, you can define one group with a single table and another group with two tables. After the first group, the distance is set to 0.2 meters (as shown in the image below), and after the second group, the gap is 5 meters. For the first group, the “YL 2×22” table (key A) is used, and for the second group, which contains two tables, the “YL 2×11” table (key B) is applied.
The keys are displayed in the array list of the field, but they cannot be changed manually.
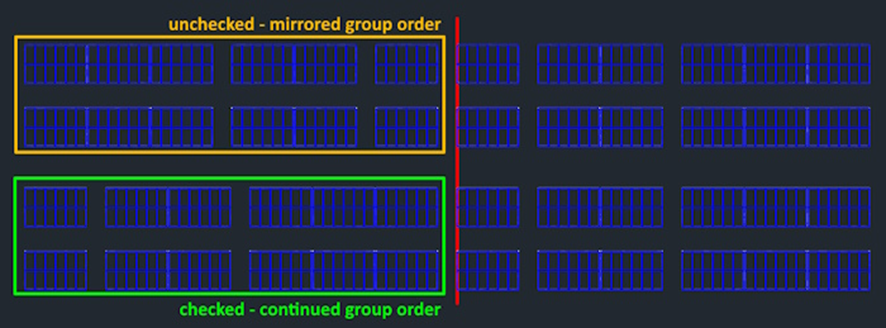
The option to mirror the groups around a Start Point Adjustment Line toggles between the following designs:
- Original Design: The groups are placed as defined, without any mirroring.
- Mirrored Design: The groups are mirrored around the Start Point Adjustment Line, altering their placement in the opposite direction.
This option allows for flexible alignment, ensuring the layout can be adjusted to fit specific design requirements.
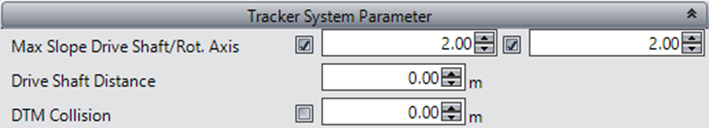
Tracker System Parameters
This command group is only active if the field is generated as a tracker field. This setup can be applied to an area before the first field is created. For detailed instructions, refer to section „Tracker System Parameters“.
The command group includes limiting values and check options for the rotation axes within the table row of a tracker, as well as for the drive shaft that controls the tilt within a tracker block.
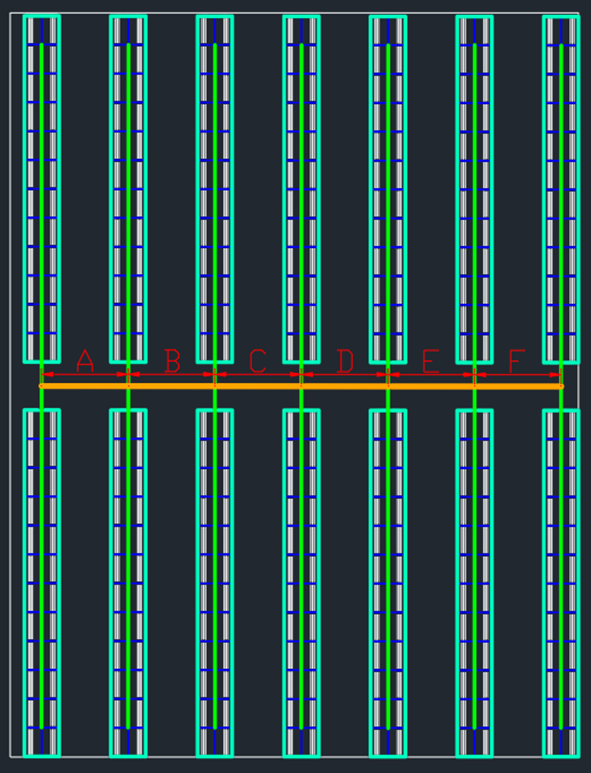
The following figure illustrates the output of such a configuration, with the drive shaft highlighted in orange and the drive shaft segments labeled A to F. The rotation axes are shown in green. At every intersection between a rotation axis and the drive shaft, a new 3D polyline is created, and the set slope limit is checked between neighboring segments.
The number of 3D polylines for the drive shaft depends on the number of rows, while each rotation axis has two 3D polylines—one on each side of the drive shaft.
Max. Slope Drive Shaft
Sets the maximum allowable slope between segments (A to B, B to C, etc.) of the drive shaft and marks the shaft segments if the slope limit is exceeded. This check typically applies in the x-direction.
Max. Slope Rotation Axis
Sets the maximum allowable slope between the segments on each side of the drive shaft and marks the table segments with a cross if the slope limit is exceeded. This check typically applies in the y-direction.
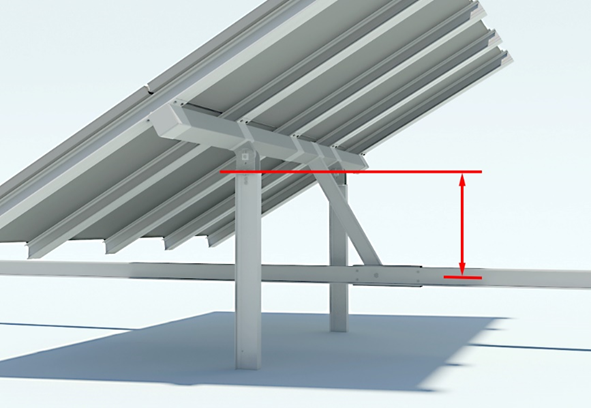
Drive Shaft Distance
Sets the distance between the drive shaft and the post head.
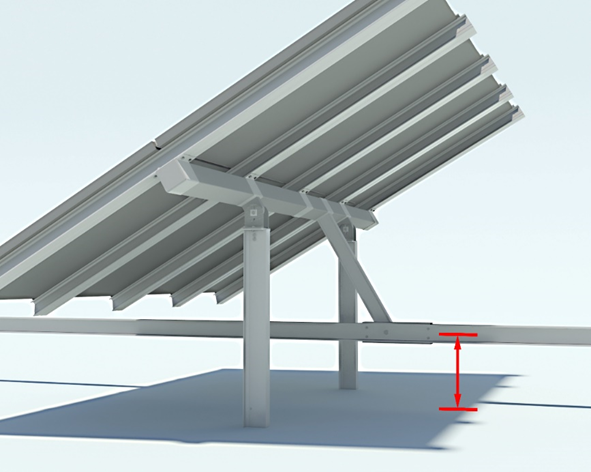
DTM Collision
Sets the minimum distance between the drive shaft and the DTM (Digital Terrain Model) for collision detection. Any detected collisions will be highlighted for the affected shaft segments.
Insertion/rotation of a tracker array to the surface
For improved surface grading, the insertion and rotation of a tracker array to the ground have been modified in the major release of version 2024. Using the overground post height would result in a different orientation after surface grading.
As a result of the new insertion algorithm, post lengths for trackers will be slightly longer than before. The previous tracker insertion height for the outer posts would cause a change in tracker orientation if the underground conditions at the post position were altered.
Placement Systematics in Tracker Systems
Trackers, unlike fixed-tilt systems, have two module edges that need to be considered for ground collision in extreme positions. These edges come much closer to the ground compared to fixed-tilt or east-west tables.
As a result, the placement rules for trackers differ significantly from those used for fixed-tilt systems, taking into account the unique movement and positioning of the modules in tracker arrays.
The rules and determinations are as follows:
- Collision Consideration: For trackers, both module edges must be checked for ground clearance, especially in extreme positions (e.g., maximum tilt angles). This is necessary to avoid collisions with the ground that could occur due to the dynamic nature of trackers.
- Module Positioning: Unlike fixed-tilt systems, where the modules remain at a constant angle, trackers have adjustable angles, meaning the distance between the modules and the ground changes depending on the tilt. Therefore, careful monitoring of both edges is essential.
- Ground Clearance: The minimum distance between the module edges and the ground is critical for trackers. In extreme tilt positions, the edges of the modules can come much closer to the ground than in fixed-tilt or east-west systems, requiring special attention to avoid any collision or overlap with the surface.
- Unique Placement Rules: The placement of trackers must account for both their movement and the variable ground clearance between module edges, which differs from the static placement used for fixed-tilt systems. These rules are specifically designed to ensure safe operation, optimal array positioning, and efficient use of space.
- Adjustable Tilt: The dynamic tilt capability of trackers must be incorporated into the placement calculations, factoring in the range of motion and potential overlap or clearance issues in different positions. This ensures that all positions of the tracker modules are checked for collisions during placement.
In the plan view, the bounding box of the horizontally aligned modules defines the reference size for the row spacing. As with HELIOS‘ standard approach, this reference size determines the free distance between two rows, also known as the passage width.
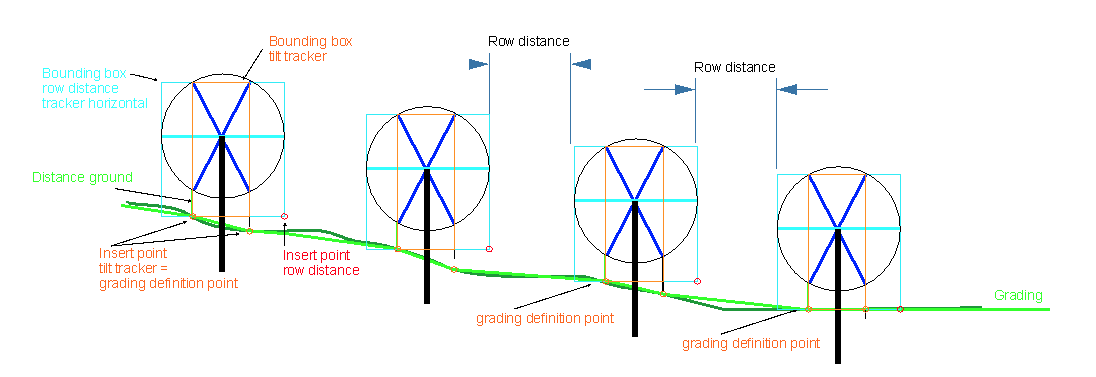
The insertion point of the tracker is located at the end of the rotation axis (the axis of symmetry of the tracker). The length of the post for horizontal ground is determined, along with the desired distance at maximum inclination (e.g., 50 cm).
The tracker is placed according to this definition. If the ground is inclined laterally to the tracker, the predetermined distance will be reduced on one side by the corresponding value. HELIOS 3D calculates the difference between the current distance of the module edge (e.g., 12 cm closer than specified) and the preset distance. The insertion height of the tracker is then increased by this value, which also raises the module edge, bringing it back to the specified distance. As a result, the overhang of the post beyond its insertion point is increased. The same adjustment occurs at the other end of the tracker. This ensures that the required distances are met at both the beginning and the end of the tracker.
In addition, HELIOS 3D checks for potential collisions or insufficient distances along the length of the tracker. The user can choose to either raise the entire tracker by the required amount (resulting in longer posts) to avoid collisions or to reduce the distance to a tolerance value (e.g., 30 cm). If this option is not sufficient or desirable, a local grading surface can be created to generate the desired minimum distance over the terrain. Since HELIOS 3D operates with the precision of the surveyed terrain and its level of detail, it allows for highly accurate terrain processing with minimal earth-moving required.
More detailed information about grading for trackers will be provided in the main section dedicated to grading.
Arrays by Requirement Types (Arrays Tab)
In the „Arrays“ tab, you can create different requirement types and assign array definitions to each one. For placement, at least one requirement type with one or more connected and selected array definitions is necessary.
This results in the following connection chain:
- Requirement Types: These serve as the categories or criteria that define the conditions under which arrays can be placed.
- Array Definitions: These are the specific configurations of arrays (e.g., type, dimensions, etc.) that are assigned to each requirement type.
- Placement: To perform the placement, you must select at least one requirement type, which will then use the connected array definitions for array positioning and placement on the terrain.
This chain ensures that the system knows what type of arrays to use and under which conditions they should be placed.
Array Definition → Default Requirement Type → Field
The figure below illustrates an example of the connection between an array and a requirement type. It shows how different array definitions are assigned to specific requirement types, demonstrating the setup needed for proper placement.
As shown in the previous Figure, you can add multiple arrays of different sizes to a single requirement type. In this case, the first array in the list will always be the first one that HELIOS 3D attempts to place in a location. If the first array cannot be placed (e.g., due to insufficient space), HELIOS will proceed to try placing the next array in the list, following a top-down order.
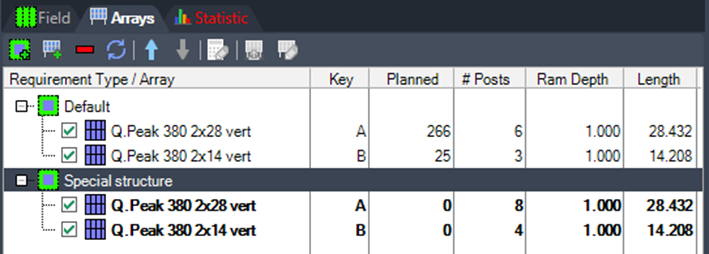
You can use multiple requirement types to place different arrays, or even the same array with varying parameters (such as different post designs), within one field. In the previous figure, the arrays in bold have more posts than those in regular letters. To achieve this, you must create requirement type zones. Once the zones are defined, you can then connect a requirement type to a requirement type zone (see section „Requirement Type Zones“ for more details).
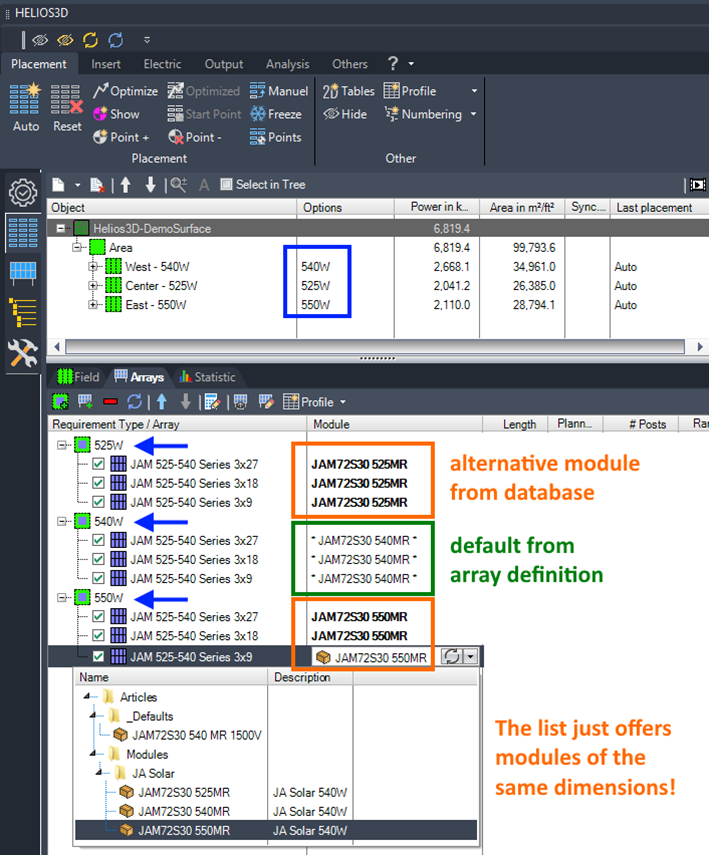
Another option is to assign different modules to the same array (PV table record) without creating a copy of the record in the database. The alternative modules must have the same dimensions as the original, such as length, width, and thickness. The list will only offer modules that match these dimensions.
There is no required relationship between the modules, so they can come from different manufacturers or series numbers, as shown in the example list below. This flexibility allows for greater variety while maintaining the same array configuration.
Buttons

Adds a new requirement type to the list, allowing you to define additional criteria for array placement and customize the configuration for specific conditions within the field.

Adds an array definition to the list. You can select an array from the available list, which includes the entire structure of „next smaller arrays“ connected to the selected array. However, these connected arrays will not be automatically selected for placement (they will not be hooked). This allows for flexible configuration without automatically applying all associated arrays.

Deletes the current selection, removing the selected array or requirement type from the list or configuration.

Refreshes the list, updating it to reflect any recent changes or additions, ensuring that the most current data is displayed. This action reloads the information to ensure accuracy and consistency.

Moves the selection upwards or downwards in the list, allowing you to reorder items as needed. This action changes the position of the selected array or requirement type within the list.

Moves the selection upwards or downwards. The order of arrays determines their priority, especially when the number of instances per field is limited for a particular array definition. Arrays higher in the list will be given higher placement priority when space is constrained.

Opens the parameters dialog for the selected component, allowing you to view and modify the settings and configurations specific to that component. This provides access to detailed options for customization.

Loads the currently selected array definition into the Array Generator, enabling you to use and modify the selected array configuration for placement and further customization within the project.

Loads the selected array definition into the Array Generator and starts the edit mode, allowing you to make changes and customize the array configuration as needed.
Edit Component (Array)
This button opens the editing dialog for the master data of the selected array definition. The dialog includes the default sections for any component (see section „New Record / Component“) as well as the „Data of the Component Type (Array)“ section (see section „New Array Definition“), where you can view and modify the specific parameters related to the array definition.
| Please note that changes to the master data of a component will affect other drawings and projects as well. Therefore, it may be wiser to create and use a copy of an existing array definition if you only intend to make changes for a specific project or drawing, rather than modifying the master data, which could impact multiple projects. |
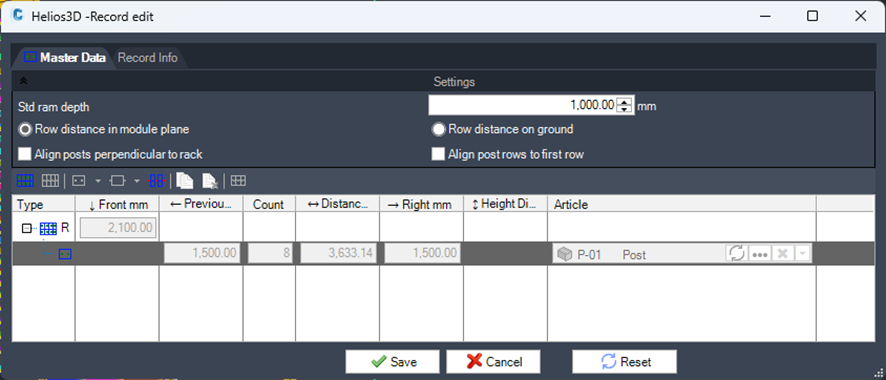
Edit Parameters (Rack)
You can overwrite the parameters of the selected arrays in the dialog displayed below. These parameters are linked to the selected entries in the “Arrays by Requirement Types” list, but they are not tied to the array definition itself. This means the changes are not saved to any database record.
As a result, you can use the same array definition for different requirement types with different parameters. This allows you to customize a rack for various surface or environmental characteristics without the need to split the field. This flexibility enables you to adapt the configuration to different conditions while maintaining a single array definition.
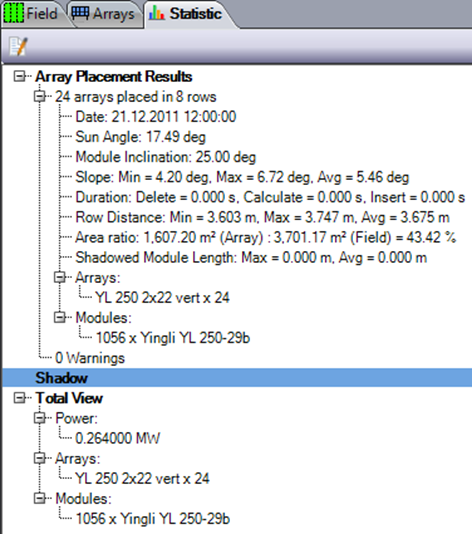
Statistic
In the “Statistic” tab, you can find the list displayed below. This list contains a protocol of the last placement run, providing detailed information about the placement process. This data can help you analyze the outcome of the last run and identify areas for optimization, allowing you to improve the efficiency and accuracy of the placement in subsequent runs.

In the Statistic Manager, you can set the displayed contents, allowing you to customize which data and parameters are shown in the statistics. This feature enables you to focus on specific aspects of the placement process, such as conflicts, placement efficiency, or other relevant metrics, to better analyze and optimize the overall placement.
Array Placement Results
Here you can see how many arrays and rows have been placed, as well as when the placement was run. Additionally, the sun angle, the minimum and maximum slope, and the durations for the placement steps—such as deleting the old placement, calculating the new placement, and inserting the results into the drawing—are displayed.
You can also view the minimum, maximum, and average row distances, along with a list of all used arrays and modules, including their quantities.
The „Warnings“ section is especially important. This counter increases each time the limits of a table are exceeded (e.g., maximum slope) during placement. As a result, no table is placed in those locations.
Shadow
Here you can see how many arrays are shadowed, along with a time stamp. This may occur if the placement settings are not configured for shadow-free placement, such as when the „Row Distance to Average“ option is used. This setting can lead to overlapping or insufficient spacing between rows, causing shadowing issues that are tracked in this section.
Total View
Here you can see the total results for the drawing after a new placement. This includes the total power of the drawing, as well as the component numbers and the quantity of all arrays and modules used in the placement. This overview provides a summary of the entire system setup, reflecting the scale and configuration of the arrays within the drawing.
Statistic Manager
In the Statistic Manager, you can select the contents that should be displayed, allowing you to customize the information shown according to your needs. This feature enables you to focus on specific data points, such as array quantities, placement efficiency, or warnings, to better analyze and optimize your project.
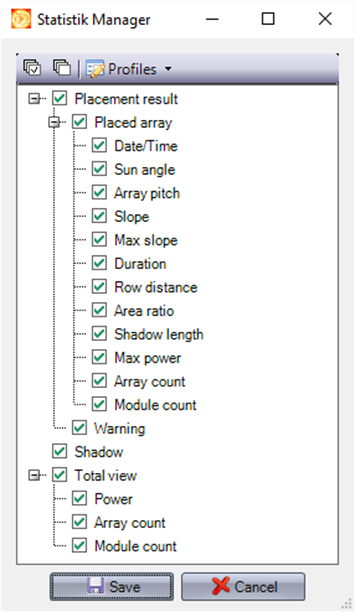

„Select all“ / „Unselect all“ allows you to quickly select or deselect all available options in the Statistic Manager. This feature makes it easier to toggle the display of all contents at once, providing a fast way to customize what data is shown or hidden.

Allows creating and managing profiles for reusing the display scheme in other drawings. This feature enables you to save custom display settings and configurations, which can then be applied to different projects or drawings, ensuring consistency and saving time when working on similar setups.