Height Analysis

The second menu contains the height analysis. Here, you can choose from different basic color schemes to represent height variations on the surface. Additionally, you can adjust these color schemes to suit your specific needs, allowing for customized visual representation of height data.
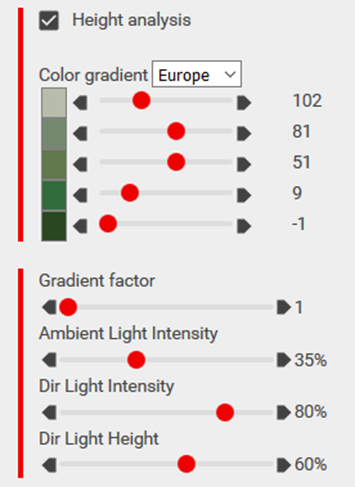
Using the gradient factor, you can scale the color scheme so that only a portion of the colors is used, improving the visual representation of the surface. Increasing the gradient factor helps prevent white tops on hills, which can appear unnatural on nearly flat surfaces.
You can further adjust the display of colors with sliders for ambient light intensity, direct light intensity, and direct light height to refine how the terrain and height analysis are visually rendered.