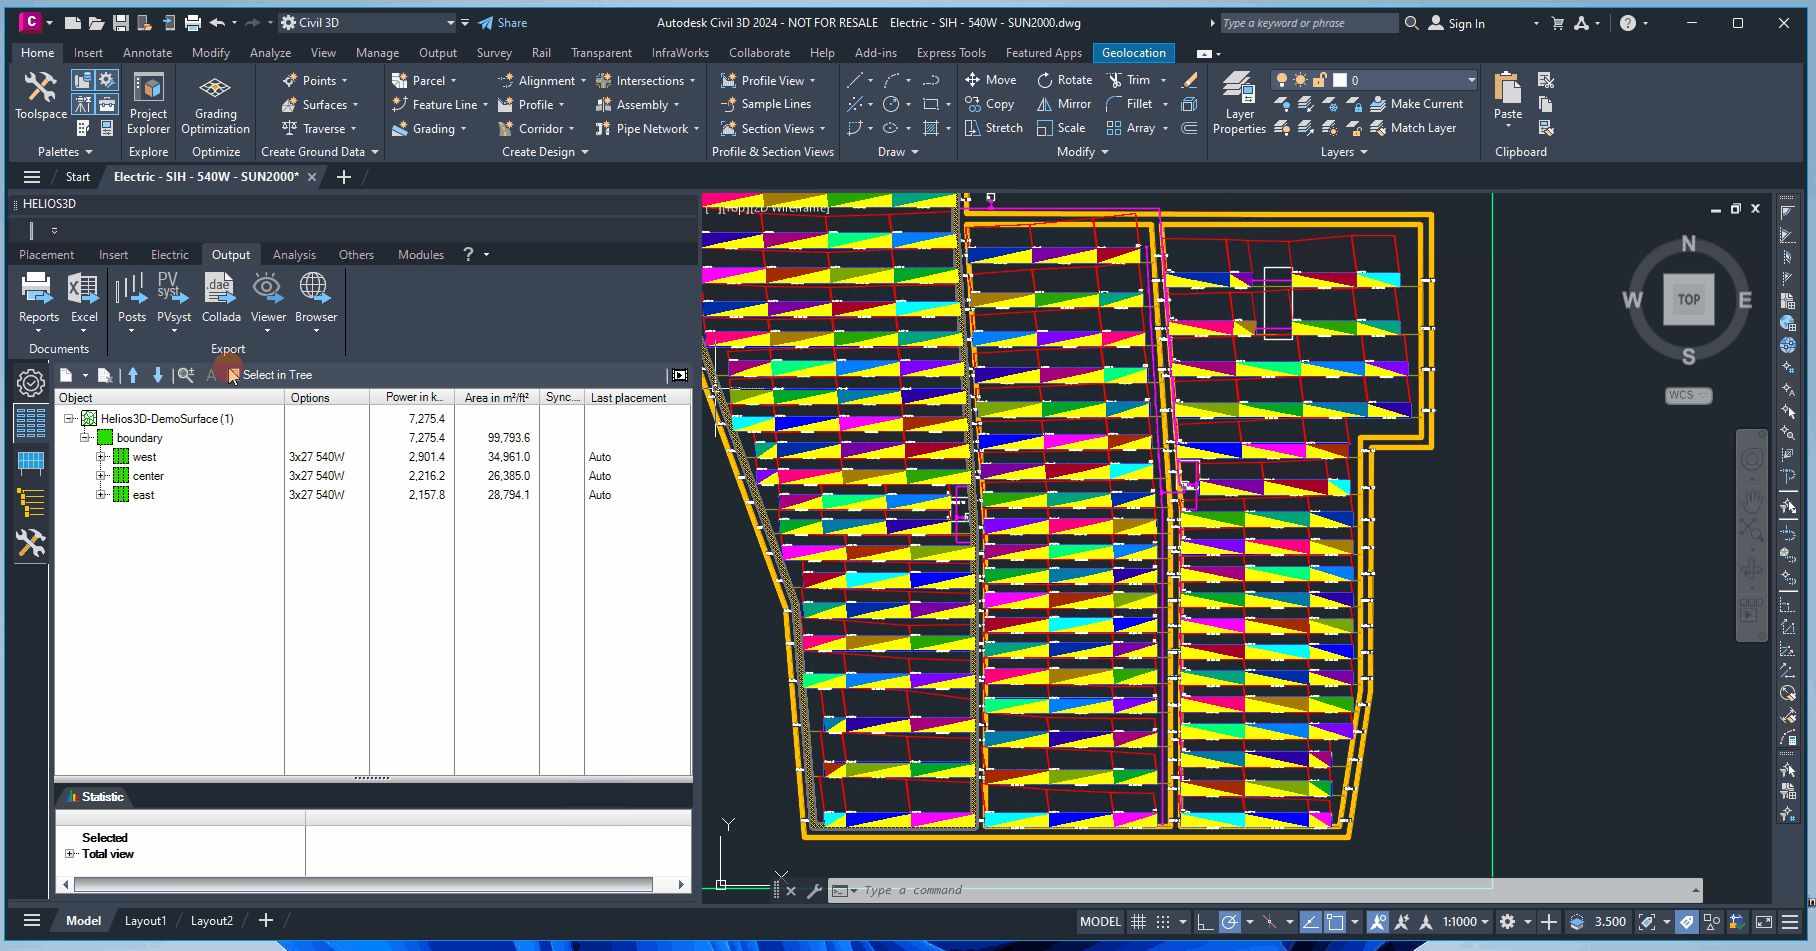
Output
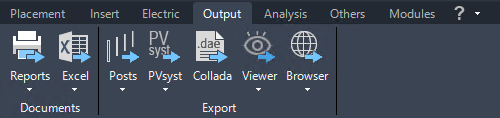
The Output ribbon contains the main commands for generating reports, Excel files, external exchange formats, and 3D visualization exports from the current Helios 3D drawing. These commands are typically used after the layout, terrain, post, and electrical planning data have been created or updated. Depending on the selected command, the output may be based on the current drawing, the selected placement structure node, the electric structure, the Digital Terrain Model, PV tables, shadow objects, or project settings.
Use this ribbon when you want to document the planning status, transfer data to other applications, prepare construction or review documents, export geometry for simulation tools, or visualize the PV plant in an external viewer or browser environment.
All available output formats are provided on this page.

Command Group Documents
Before creating reports or exports, check that the current drawing contains the data required for the selected output. For example, placement statistics require valid placement results, post exports require generated post objects, electrical reports require an existing electrical structure, and performance-related browser views require a completed yield calculation. If the required project data is missing or outdated, the generated output may be incomplete or may not reflect the current planning state.
The Documents command group provides report and list outputs for project documentation. These outputs are intended to make important planning results available outside the drawing, for example as PDF documents, Excel files, or structured lists. The exact content depends on the current project data and on the drawing objects that are available at the time of output generation.
Print Reports
This section includes various reports that can be generated for the current drawing and then saved in external formats, such as PDF or Excel. The available reports are: Project Overview, Post Report, Cable List, and Electrical Structure.
Print Project Overview
Opens the print dialog with the project overview report.
Print Post List
Opens the print dialog for the post list.
Print Cable List

Opens the print dialog for the cable list.
Print Electrical Structure

Opens the print dialog for the Electrical Structure.
The reports are generated from the current Helios 3D project and drawing data. They can be used for internal checks, project documentation, coordination with other project participants, or as a basis for further processing. Before printing or saving a report, verify that the relevant drawing has been updated and that the required project, placement, post, cable, or electrical data is available.
Excel Exports
Offers various formats for generating Excel lists.
Excel exports are useful when planning results need to be reviewed, filtered, compared, or processed outside Helios 3D. The exported data may depend on the selected node in the placement structure tree. When using multi-selection, make sure that the selected fields, areas, or DTMs belong to the same parent node where this is required by the command.
Export Array Placement Statistic
Use this export to document the placement result for a selected part of the project structure. This is useful for checking quantities, comparing fields or areas, and transferring placement-related values to external spreadsheets. If no suitable node is selected in the placement structure tree, or if the selected nodes do not share the required parent structure, the export may not produce the expected result.

Saves the placement statistic for the node selected in the placement structure tree. Fields or areas or DTMs can be selected and for multi-selection, only nodes with the same parent are allowed.
Export extended placement statistic with tables

Saves the extended placement statistic for the node selected in the placement structure tree. An entry for any PV table insertion is added to the row entries on the second page. Fields or areas or DTMs can be selected and for multi-selection, only nodes with the same parent are allowed.
Export Electric Structure Tree
This export is intended for reviewing the electrical hierarchy and cable-loss information outside the Helios 3D interface. It can be used to document the current electric placement structure or to share the structure with other project participants. Verify that the electrical placement has been generated or updated before creating the export.

Exports the structure tree for the electric placement into an Excel file. The result file matches the display of the „Electric Structure“ view including the cable losses. The exports always show each structure tree on a separate sheet, but in the same document.
Export cable connections to Excel
Generates sheets for string cables and cable connections between devices.
Command Group Export
The Export command group provides exchange formats for transferring geometry, terrain, post, module, shadow, and visualization data to external applications. These exports are typically used for construction preparation, simulation, visualization, or further analysis outside Helios 3D. Because export formats may be interpreted differently by target applications, always verify the exported file in the receiving software.
Export Post List
This section provides three functions for exporting drawing data to different programs.
- Post List Export: Exports the post list into a C3D file. This file type is a plain text format and can be edited with any text editor.
- Data Format: The exported data is stored in the following structure:
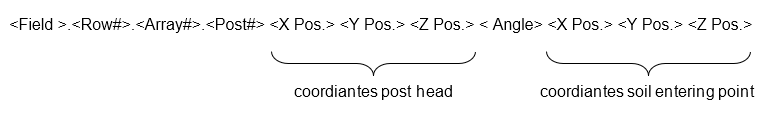

The provided data excerpt represents the first post in the second rack (array) of the third row in „Field_North“ (with spaces replaced by underscores).
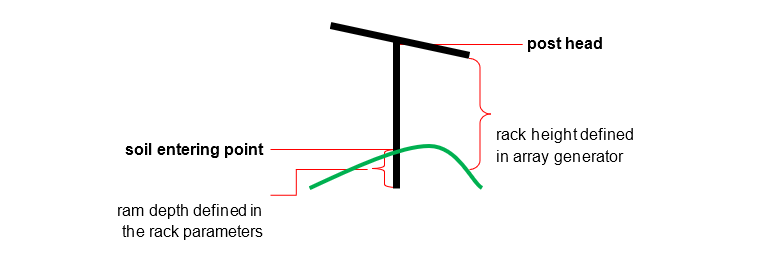
- X-, Y-, and Z-Values: These values specify the insertion point of the post in world coordinates (WCS) and correspond to the starting point (post head) of the line that visually represents the post.

The rotation of the post in our example is 100 Gon.
The X-, Y- and Z-values behind the rotation angle mean the entering point to the soil.
The simple graphic below shows the meaning of the two points from export file entries.
The post list export contains coordinate and orientation information for post positions. These values can be relevant for stakeout, construction preparation, or machine-controlled post installation workflows. The exported coordinates refer to the drawing coordinate system and should be checked against the project coordinate system and the requirements of the target application before they are used on site.
PVsyst Export
Exports the surfaces of a Digital Terrain Model (DTM), the photovoltaic active planes of the modules, and shadow objects into a text file with the extension *.H2P. This file can be imported into PVsyst for shadow analysis and profit calculations.
The PVsyst export is used to transfer relevant 3D planning data from Helios 3D to PVsyst. This may include terrain surfaces, active module planes, and shadow objects. The export supports the analysis of shading and energy-related effects in a specialized PV simulation environment. Before exporting, check that the terrain model, PV tables, and shadow objects are complete and correctly positioned.
Export with Field Selection
Use the field selection option when only specific parts of the layout should be exported. This can reduce the amount of exported geometry and make the data easier to handle in the target application. This option is especially useful for large projects or when only selected fields are relevant for the next analysis step.
Calls the PVsyst export with an additional dialog before the final export. In that dialog you can explicitly select those fields that should be exported, so the data set will be reduced.
Clicking the export button exports the entire drawing. Alternatively, clicking the small arrow on the right opens a dialog box where you can select specific fields for export. Additionally, you can restrict the export of surface triangles to designated area or field boundaries using the relevant checkboxes.

Format Description:
The document is structured with the keywords START and END marking its beginning and end, respectively. The content within follows this schema:
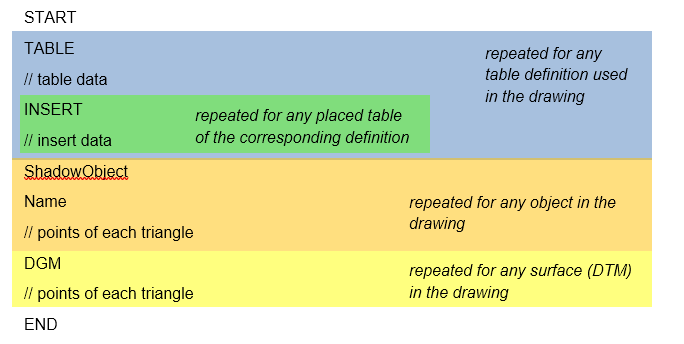
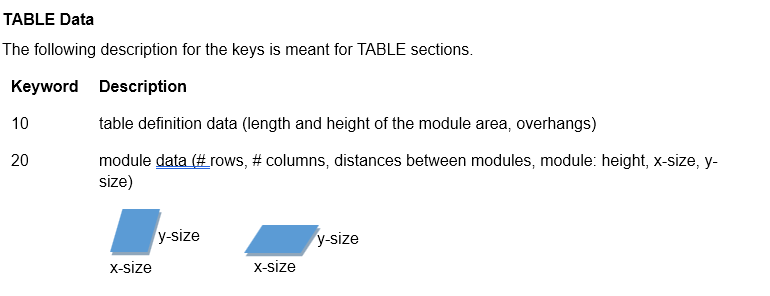

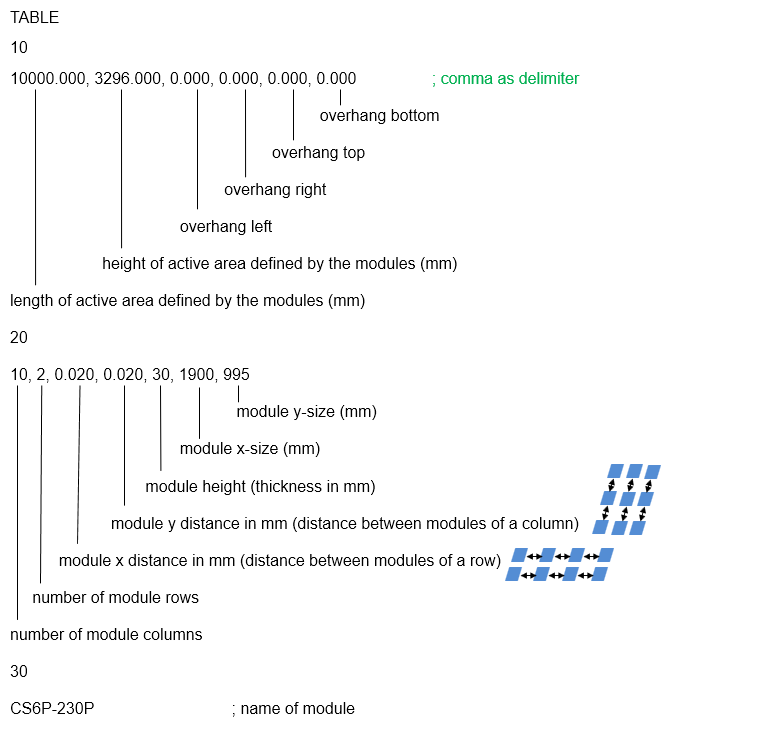
The table definition data is structured as follows:
INSERT Data
The following description for the keys is meant for INSERT sections.
| Keyword | Description |
| 10 | 3D coordinate of the insertion point |
| 50 | azimuth |
| 55 | slope angle |
| 56 | module inclination |
The structure of the insert data looks as follows:
INSERT
10
0.000, 0.000, 0.000 ; x, y, z
50
0.000 ; azimuth angle
55
-2.929 ; slope angle
56
30.000 ; inclination angle
Shadow Objects
We describe all shadow objects using triangles, as this provides a universal representation for all possible shapes. Customers can also create custom objects using specific AutoCAD mesh objects.
The structure of the shadow object data is organized as follows:
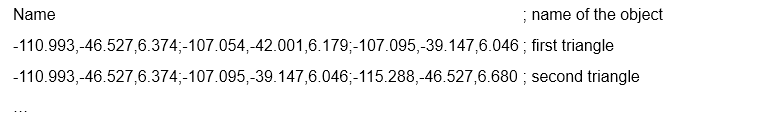
DGM (DTM / Surface) Data
In the DGM section, each line represents one triangle of the surface. The structure of each line is as follows:
Example for an Export File:
File Text: Comments:
START ; start flag of the file
TABLE ; definition of the dimensions of the first table follows
10 ; table definition data follows
6077.500,3337.800,0.000,0.052,0.039,0.039; length, height, overhang: left, right, top, bottom
20 ; module definition data follows
6,2,0.021,0.010,30,1900, 995 ; # columns, # rows, x distance, y distance, height, x, y
30 ; module name follows
Modul 160W 1638×983 ; module name
INSERT ; insertion information of the first table follows
10 ; insertion point follows
0.000,0.000,0.000 ; x, y, z
50 ; azimuth follows
0.000 ; angle in degrees
55 ; slope follows
1.586 ; angle in degrees
56 ; module inclination follows
30.000 ; angle in degrees
INSERT ; insertion information of the next table follows
…
TABLE ; definition of the dimensions of the next table follows
…
DGM ; definition of the first DTM / surface follows
-110.993,-46.527,6.374;-107.054,-42.001,6.179;-107.095,-39.147,6.046 ; first triangle
-110.993,-46.527,6.374;-107.095,-39.147,6.046;-115.288,-46.527,6.680 ; second triangle
…
DGM ; definition of the next DTM / surface follows
…
END ; end flag of the file (confirms the valid ending)
Export scene to COLLADA format
COLLADA export can be used when a neutral 3D exchange format is required. The export is suitable for transferring selected drawing objects to applications that support .dae files. The available options should be checked carefully, because the selected object types and export settings determine which parts of the Helios 3D model are included in the resulting 3D scene.
Opens the dialogue to export the drawing to the .dae format. The objects that should be included can be chosen freely by that. COLLADA is an XML-based open exchange format for 3D data between different 3D applications.
PVsyst is one application that can read this format.
COLLADA is an XML-based open exchange format designed for transferring 3D data between different 3D applications. PVsyst is one such application that can read and utilize this format.
Offset point
Use the offset point option when the target application has problems with large coordinate values. By shifting the exported scene closer to a local origin, the geometry may be easier for external 3D or simulation software to process. The original georeferencing context should still be documented and checked if the target workflow depends on real-world coordinates.
Some software products can’t handle large drawing coordinates. This offset

allows exporting the center of the surface as origin point of the scene.
Georeference point model
The georeference point model provides location information based on the GPS coordinates stored in the Helios 3D project settings. This information may be important for target applications that use geographic position, sun path, or illumination models. Check the project settings before export to make sure that the georeference information is correct.
Sets the reference point for the exported model, representing the GPS coordinates from the Helios 3D project settings. This information may be required by some target applications for their illumination models.
Limit DTM geometry
This option can reduce the size and complexity of the exported terrain geometry. It is useful for large terrain models or when the target application has performance limitations. Reducing the DTM geometry may also reduce detail, so the exported result should be checked visually and technically after import.
Module thickness
Some target applications display module geometry differently from Helios 3D. The module thickness option can help adapt the exported representation to the requirements of the receiving software. The visual and analytical effect of this setting should be checked in the target application.
Export post data (NASKU)
Writes the post data in the format defined for NASKU’s GPS-controlled GAYK rams to the export file.
These functions enable experimental analysis features for posts when activated during the new Viewer export.
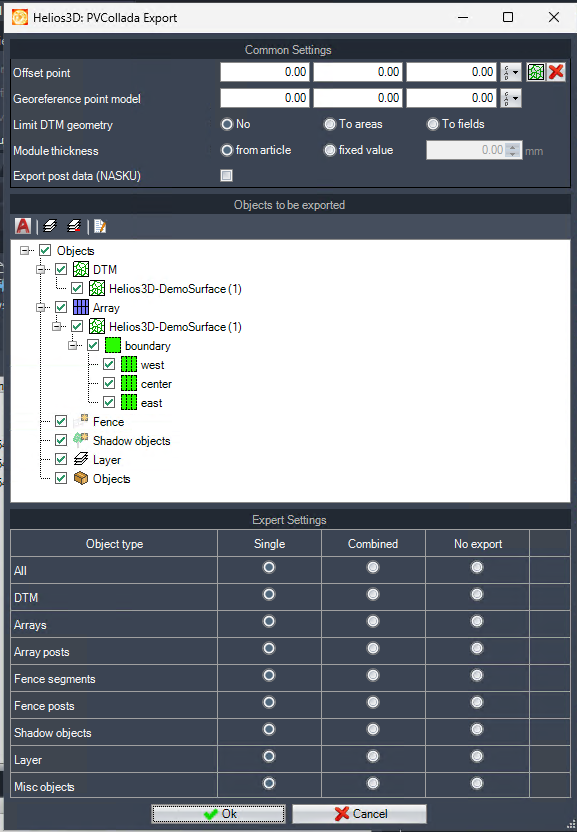
Objects to be exported / Expert Settings
The object selection and expert settings control the content and structure of the export file. Depending on the target workflow, objects can be exported individually or combined into larger blocks. Use these settings carefully, because they influence file size, object handling, import behavior, and the ability to identify individual elements in the target application.
Start Helios 3D Viewer
The Helios 3D Viewer export creates an interactive 3D scene of the current layout. This can be used for visual project review, presentation, and spatial inspection of the PV plant. Because the viewer is installed or updated automatically when the command is called, internet access or local installation permissions may be required depending on the workstation setup. Should be editorially checked.


Opens the dialogue to generate a 3D scene of the layout in an external viewer. You can move through this scene in flight mode.
The Helios 3D Viewer automatically installs and updates itself by this call.
Load Browser View
The browser view creates a 3D environment that can be opened in the default web browser. It is intended for interactive visual inspection of the planning area and the PV layout. Browser support for WebGL is required. If the browser view does not open correctly or remains empty, check the browser type, WebGL support, graphics driver, and whether the selected export option requires previously calculated performance data.
Opens the options dialog for generating a 3D environment including your planning area and displaying it in your default web browser. You can move through this 3D area in flight mode. For showing the array performance in browser view, you must use the corresponding option from the submenu after a yield calculation has been processed.
Attention: For this function your web browser must support WebGL!
Recommended Web Browsers: Firefox, Chrome
Browser Export with Array Performance
This option adds array performance information to the browser-based 3D scene. It should be used after a yield calculation has been completed. If no performance values are shown, verify that the yield calculation exists, that the selected month or yearly result is available, and that the browser export was started from the correct submenu option.
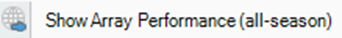
Generates the regular 3D scene and displays for any array its yearly performance, respectively the performance for the selected month.
Troubleshooting and checks before exporting
If an output file is missing, incomplete, or does not contain the expected data, first check whether the required planning data exists in the current drawing. Placement exports require valid placement results, post exports require post data, electrical exports require an electric structure, and performance-related exports require calculated yield data. Also check write permissions for the selected output folder and verify whether the target application supports the selected file format.
For large projects, export files may become very large. In this case, use field selection, limit the DTM geometry, or export only the object types required for the target workflow. After importing the file into another application, always compare the geometry, coordinate position, object selection, and relevant values with the original Helios 3D drawing.