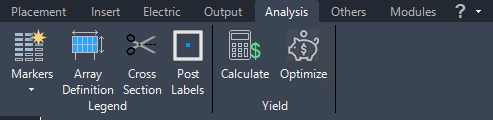
Analysis
The Analysis command group provides tools for visualizing, documenting and evaluating PV layouts in Helios 3D. It includes marker schemes for arrays, posts, modules and surfaces, snapshot functions for converting temporary analysis graphics into printable AutoCAD objects, tools for post report filtering, array legends, cross section views and yield-related assessment functions.
Use this section when you want to check layout properties visually, prepare analysis graphics for drawings or reports, compare layout variants, or create supporting documentation for technical review and project communication.
Command Group Legend
The Legend commands are mainly used after a layout has been created and should be reviewed, documented or prepared for output. Marker schemes help to highlight specific value ranges or object groups in the drawing. Some of these graphics are temporary display elements, while snapshots convert selected temporary hatches into standard AutoCAD objects that can be selected, printed and included in drawing documentation.
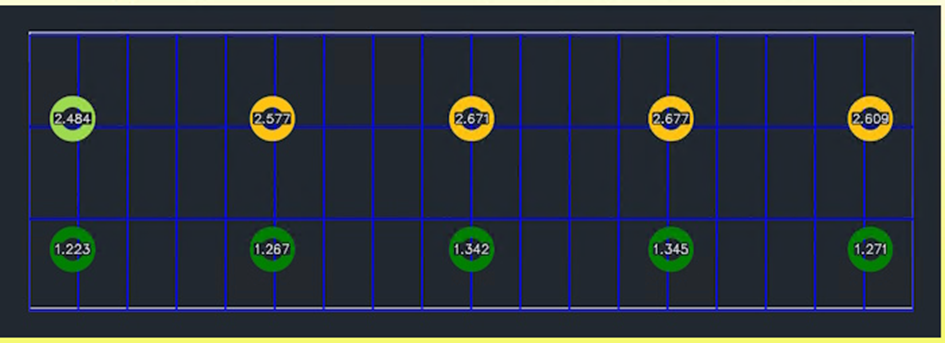
Marker Schemes
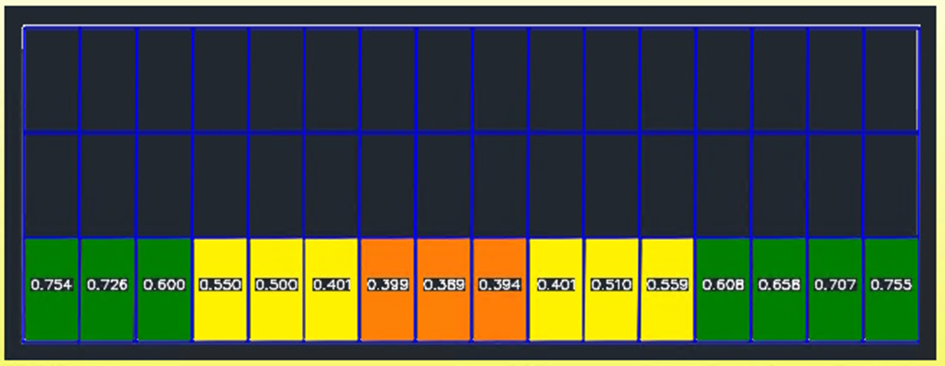
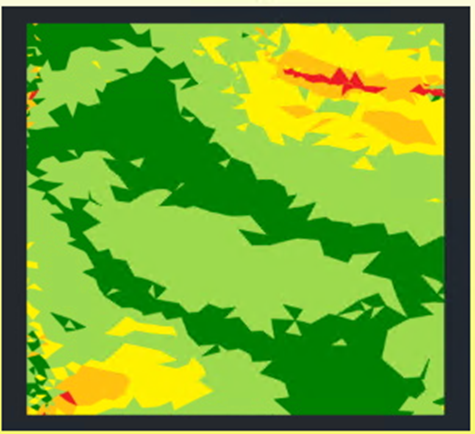
Marker schemes can be used to visually classify layout elements such as arrays, posts, modules or surfaces. Typical use cases include checking value ranges, identifying groups of objects, reviewing terrain-related or layout-related differences, and preparing visual feedback for planning decisions.
Not all marker displays are intended as permanent drawing content. If the visualization must be printed or transferred as part of a drawing, use the snapshot function to create standard AutoCAD hatch objects.
Functions for different marker schemes for arrays, posts, modules and surfaces. For each type, intervals can get defined with separate colors for temporary hatches or circles. The snapshot command will change displayed temporary hatches into standard AutoCAD objects.


Hide Markers

Hides all displayed markers.
Create snapshot

Use this command when temporary marker hatches should become permanent drawing objects. The created snapshot objects can be selected and printed like regular AutoCAD hatches. This is useful when analysis results must be included in layout drawings, review plans or exported documentation.
Important: Snapshot objects represent the marker display at the time of creation. If the layout or marker scheme changes later, the snapshot may no longer match the current project state and should be recreated.
Creates a snapshot from the displayed temporary hatches belonging to marker schemes. These get inserted as AutoCAD hatches, which are selectable and printable.
Delete snapshots

This command removes the snapshot objects that were created from marker schemes. It is useful for cleaning up the drawing before creating a new analysis snapshot or before finalizing a drawing without temporary analysis graphics.
Important: The page states that objects on the layer “H3D_Snaphost” are deleted. The spelling of this layer name should be editorially checked. If the correct layer name is “H3D_Snapshot”, the Help-Center text should be corrected.
Deletes all objects on the layer „H3D_Snaphost“.
Create post markers to filter report

Post markers allow a selected group of posts to be identified for reporting. When a post report is printed, the marked posts can be used as a filter so that only the relevant posts are included. This is useful for staged construction areas, selected terrain zones, quality checks or partial documentation of a project.
Opens the dialog for creating a post marker scheme for the selected fields. On printing a post report, you can choose to just include such marked posts.
Delete post markers for reports
Use this command to remove post markers that are no longer required for report filtering. This helps avoid outdated or unintended filters when creating new post reports.
Important: Before deleting post markers, check whether they are still required for the current report workflow or for communication with construction, surveying or quality control teams.
Deletes post markers from the drawing.
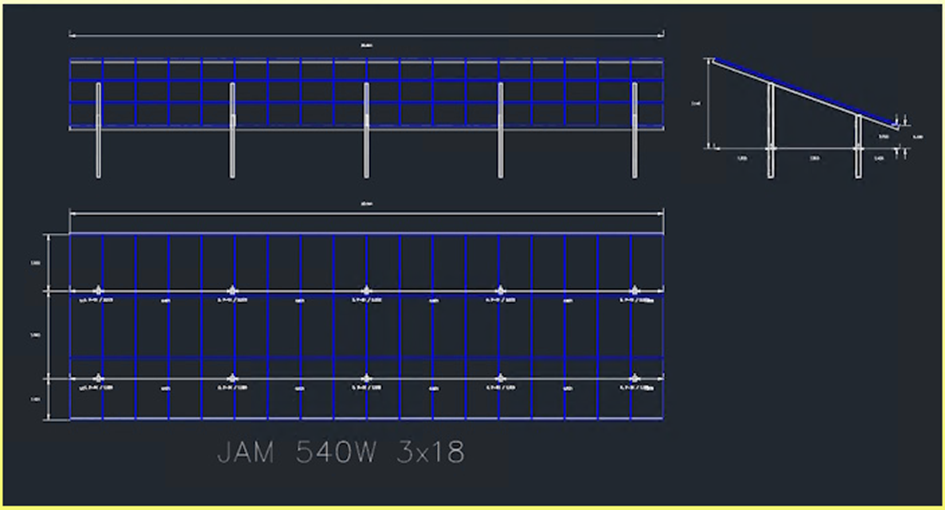
Insert Array Legend
The array legend provides a compact graphical description of an array definition. It can include top, front and side views as well as relevant geometry dimensions. This helps users and project stakeholders understand the construction geometry of the selected array type directly in the drawing.
The function uses the dimensioning style “H3D_AL”. If the legend does not appear as expected, check whether the dimension style is available and whether the selected array definition contains the required geometry information.
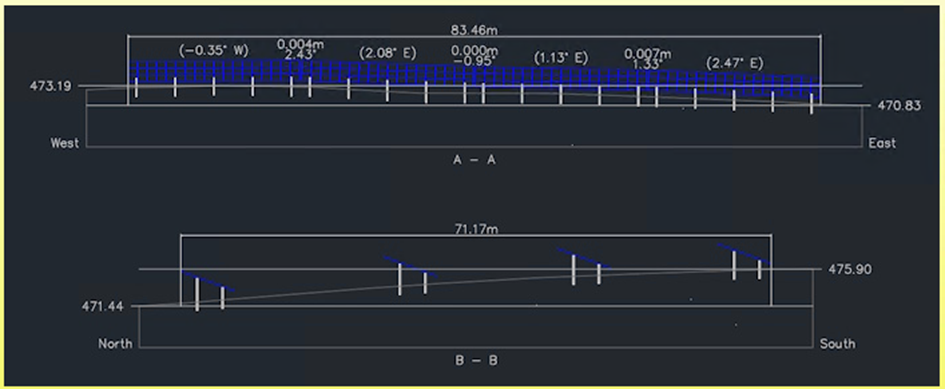
Create Cross Section View
Cross section views can be created along a row or perpendicular through rows. They are useful for checking the relationship between the PV layout, row geometry and terrain-related height development. Cross sections can support layout review, constructability checks and communication with civil engineering or construction teams.
The function uses the dimensioning style “H3D_CS”. If the cross section dimensions are missing or displayed incorrectly, verify that this dimension style exists and that the selected row or row direction is suitable for creating the section. Section views.
Command Group Yield
The Yield commands support the evaluation of layout variants from an energy-oriented perspective. They do not replace a detailed external yield simulation, but they help to compare layouts and identify promising inclination and orientation settings during the planning process.
Run Yield Assessment

The yield assessment opens a dialog for evaluating the current layout based on calculation parameters and device values. It can be used to compare different layout alternatives and to identify which layout performs best under the selected assumptions.
Run Module Angle Optimization

Module angle optimization checks different module inclination angles and array orientations on a flat surface. The resulting report helps identify an ideal module orientation under simplified conditions. This makes the function useful for early design comparison and for understanding the influence of tilt and azimuth on expected power.
Important: The result is based on simplified flat-surface conditions. It should be reviewed carefully before applying the values to complex terrain, shaded areas or project-specific design constraints.